Software, Data Visualization and Example Notebooks
Data Formatting Standards and Computational Pipelines
Many Spatial Transcriptomics methods are based on a common pattern of data acquisition: images are collected in multiple fluorescence channels after a round of readout chemistry, and this process is repeated until all fluorescent readouts have been imaged. Similarly, the compuational processing pipelines to turn raw images into transcriptional profiles of cells share many computational steps. In this context, the SpaceTx Consortium pursued two software projects:
SpaceTx-Format is a fully-specified format for image-based spatial transcriptomics raw data, including spatial structure of images in 3D, description of round-channel organization and a specification for the “codebook” relating fluorescence images to gene identity.
starfish is a Python package that provides processing modules that can be assembled into completel processing pipelines to extract mRNA locations for barcode methods (MERFISH, SEQFISH), sequencing-based readouts (ISS, FISSEQ) and non-barcoded readouts (osmFISH).
Both of these projects are housed in the starfish github repo and can be cited using the starfish article in Journal of Open Source Software.
Data Visualization
Spatial Transcriptomics data presents unique challenges for visualization.
- Visualization of processed spatial transcriptomics data
- Processed Spatial Transcriptomics data typically includes:
Spot Tables: Spatial locations for all mRNA spots detected in the experiment.
Cell by Gene Tables: Cell locations and the total mRNA counts associated with each cell.
Overview Image: spatial context for high-resolution data. For example, SpaceTx Consortium data includes high resolution data of mouse VISp and the overview image includes a DAPI image of the entire coronal section containing the VISp data.
- Cell by Gene Visualization in Cytosplore
Boudewijn Lelieveldt and the Cytosplore Team have created a project-specific Cytosplore viewer for interactive exploration of SpaceTx cell by gene data
download link:
walk-through or screenshot
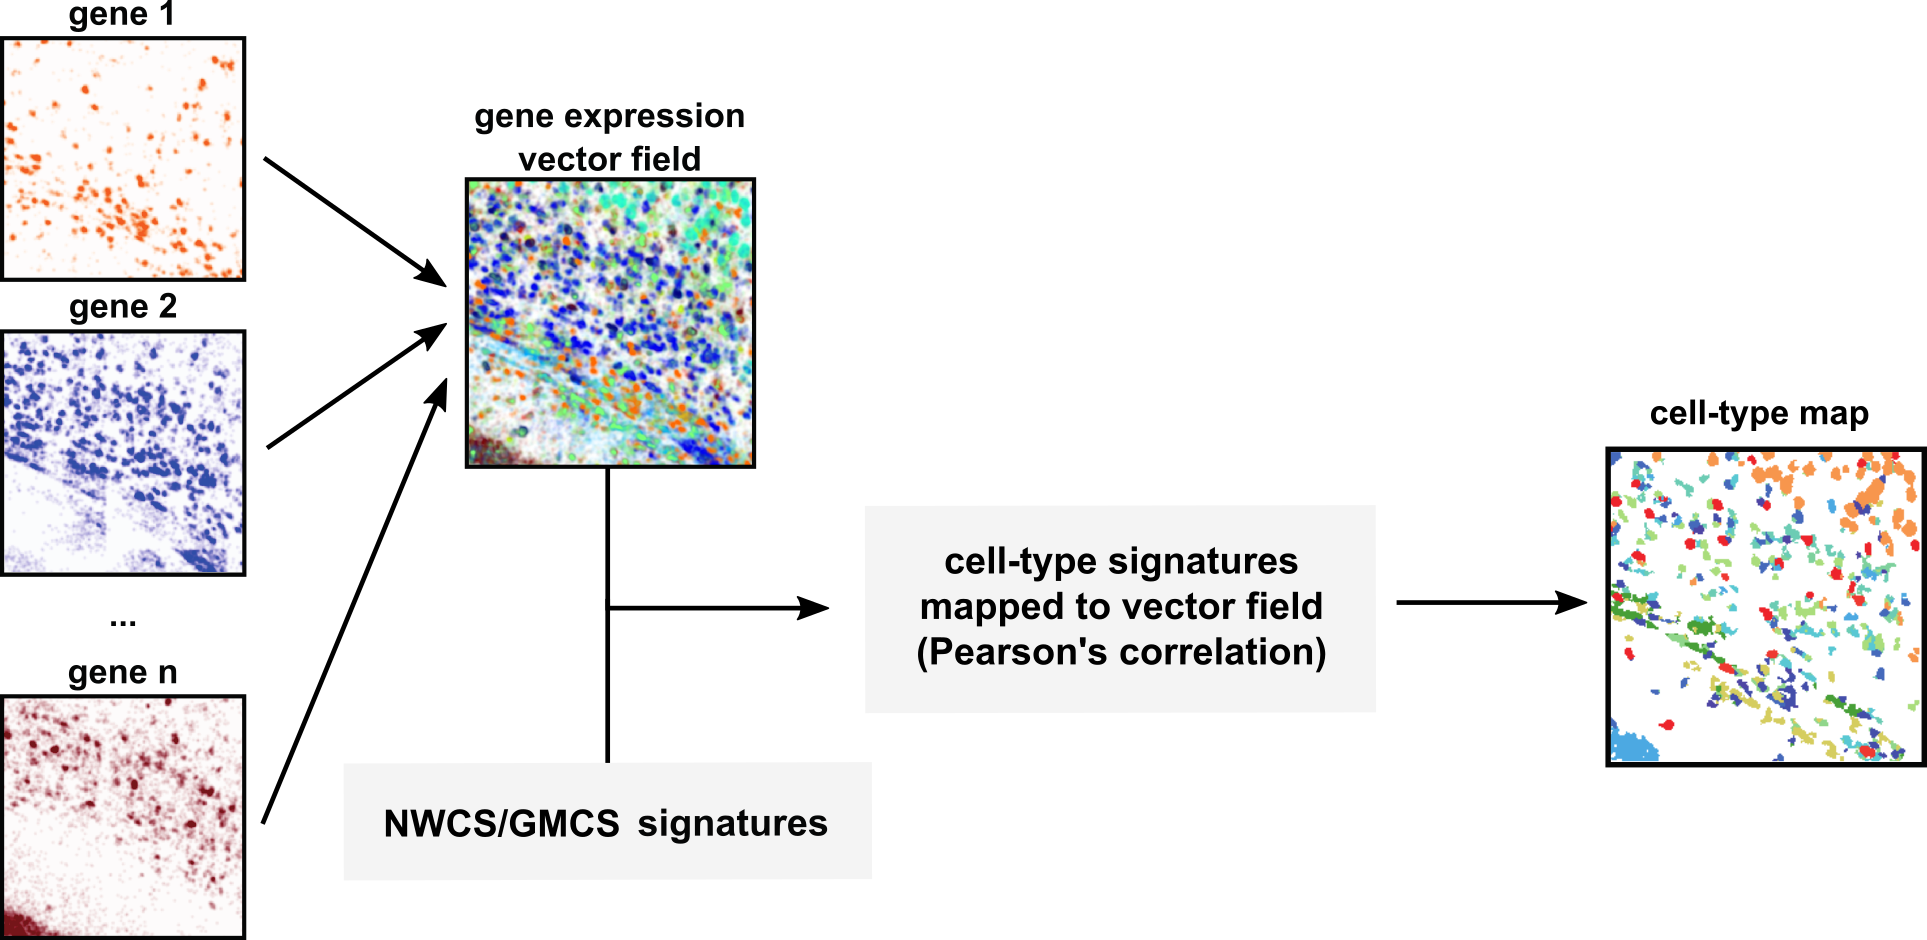
- Segmentation-free data analysis and visualization
The heterogeneity of gene expression in tissue can be explored without cell segmentation.
The SSAM method (Nature Communications volume 12, Article number: 3545 (2021)) applied to SpaceTx data creates an easily visualized landscape of gene expression that can highlight rare cell types or tissue organization.
- Image Data Visualization
Unlike traditional biological imaging, spatial transcriptomics image data is often uninterpretible on its own. For example, each (round,channel) image from a MERFISH experiment typically contains diffraction-limited spots from all copies of 10s of different mRNA species. However, an image of DAPI from the same experiment could be very useful for visualizing tissue context for processed spatial transcriptomics data.
Raw image data for spatial transcriptomics is frequently at the terabyte scale and visualization requires comprehension of the spatial and (round,channel) organization of the images.
Modern bioimage visualization tools such as Neuroglancer and Napari can be used to visualize spatial transcriptomics image data, but only to the extent that image data format information is interpretable by the visualization tool. Visualization tools will become more interoperable when and if the bioimaging community converges on formats and metadata standards for multiround fluorescence experiments. Large community standards projects like OME-NGFF as well as smaller, nascent projects like useq-schema could form the basis of a metadata standard that could be applied to spatial transcriptomics microscopy data to simplify interactive visualization of large scale image data.
R Markdowns / Jupyter Notebooks & Scripts
- CZI Human : Dimensionality Reduction and Clustering with SIMLR
- CZI Mouse : Dimensionality Reduction and Clustering with SIMLR
- Script for consensus clustering (GMCS)
- Cell type calling for spatial transcriptomics (spaceTx) data - smFISH and scRNAseq
- SSAM Notebook: Multiplexed smFISH data SSAM analysis
- SSAM Notebook: (Allen) MERFISH data SSAM analysis
- SSAM Notebook: BaristaSeq data SSAM analysis
- SSAM Notebook: ExSeq data SSAM analysis